This is the third feature of a new series, where we’ve done the hard work in finding you the best sites out there to give you new angles of great information, insight and analysis to help you with those all too important football bets!
Betting Tips: Predicting the Goals Scored
Ask any football fan what matters most in their sport, and most, if not all, will say winning. Winning, of course, is a function of goals. And the relationship between goals scored and goals conceded has always fascinated football fans and betting enthusiast alike. For those willing to examine the wealth of data available, there are several resources out there to provide insight and trends when planning your next footballing bets in relation to goals scored and conceded. For this edition, we’ll focus on the offence, examining some factors to help you consider how to assess goals across home and away games, the impact of form, the timing of goals across the 90 minutes, where to find stats about winning each half, and the relevance of who scores first.
1 – How many goals, and where?
At a basic level, the most obvious place to start in predicting the goals of a typical match is current scoring records. An examination of a sample of the current English Premier League table gives a broad perspective on how to predict goals. The “GF (Goals For)” column indicates the scoring records of the top 6. Analysed against the matches played, some simple numbers emerge:

Figure 1: Source – whoscored.com
| Goals Scored per Game | Total Goals per Game | |
| Man City | 2.83 | 3.50 |
| Liverpool | 2.26 | 3.40 |
| Chelsea | 1.73 | 2.63 |
Using the Premier League standings available on www.whoscored.com, across comparisons of Man City, Liverpool and Chelsea (as a quick sample set), given the history, one would expect overall, that Man City are more likely to score at 1 goal more per match than Chelsea, and both Liverpool and Man City are typically likely to score 2 goals in any given match. However, this is too simplistic a view, because football seldom works like this. That’s why it’s more important to examine the numbers in richer detail:

Figure 2: source – whoscored.com
| Overall Goals Scored per Game | Overall Total Goals per Game | Goals Scored per Home Game | Overall Total Goals per Home Game | |
| Man City | 2.83 | 3.50 | 3.40 | 4.06 |
| Liverpool | 2.26 | 3.40 | 2.20 | 2.86 |
| Chelsea | 1.73 | 2.63 | 1.73 | 2.46 |
Clicking on the “Home” tab, already some interesting contrasts emerge when looking at home games. Man City score 1 extra goal every 2 home games by comparison to their overall record. Liverpool home games are less likely to produce the 3 goals that their overall average illustrates. In simple terms, this means bets on a 3-0 Man City win and a 2-0 Liverpool win at their respective home grounds represent the most likely minimum of results. Lastly, spare a thought for Arsenal, who have scored 70% of their goals at home; a massive extreme to indicate where the betting chips should fall.
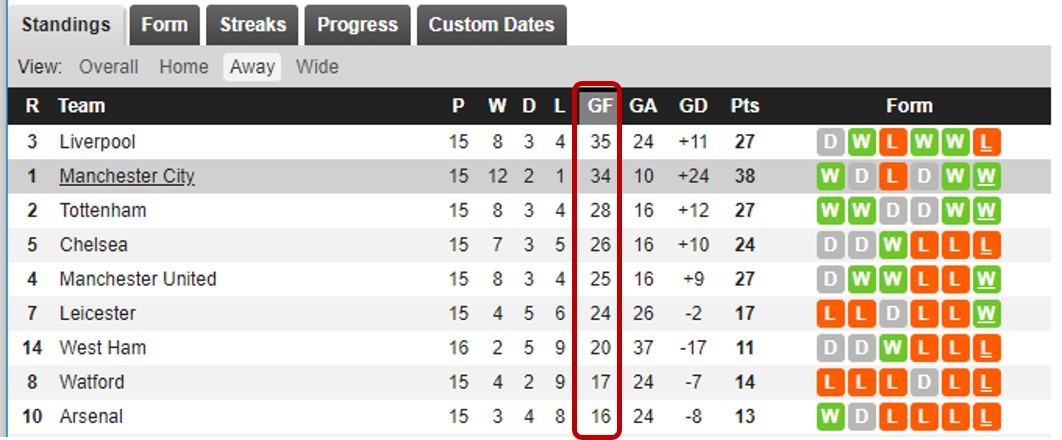
Figure 3: source – whoscored.com
| Overall Goals Scored per Game | Overall Total Goals per Game | Goals Scored per Away Game | Overall Total Goals per Away Game | |
| Man City | 2.83 | 3.50 | 2.26 | 2.93 |
| Liverpool | 2.26 | 3.40 | 2.33 | 3.93 |
| Chelsea | 1.73 | 2.63 | 1.73 | 2.80 |
Clicking the “Away” tab offers a contrasting the away record that is equally compelling. Liverpool are most goal flush of any top 6 in terms of away record, but what’s revealing is that their total goals per away game scales up so much that it’s reasonable to suggest that the average Liverpool away fixture is quite likely to produce a score draw of 2-2 in several cases. So any betting enthusiasts looking at Liverpool fixtures may want to keep this in mind when selecting a bet for both teams scoring, for example.
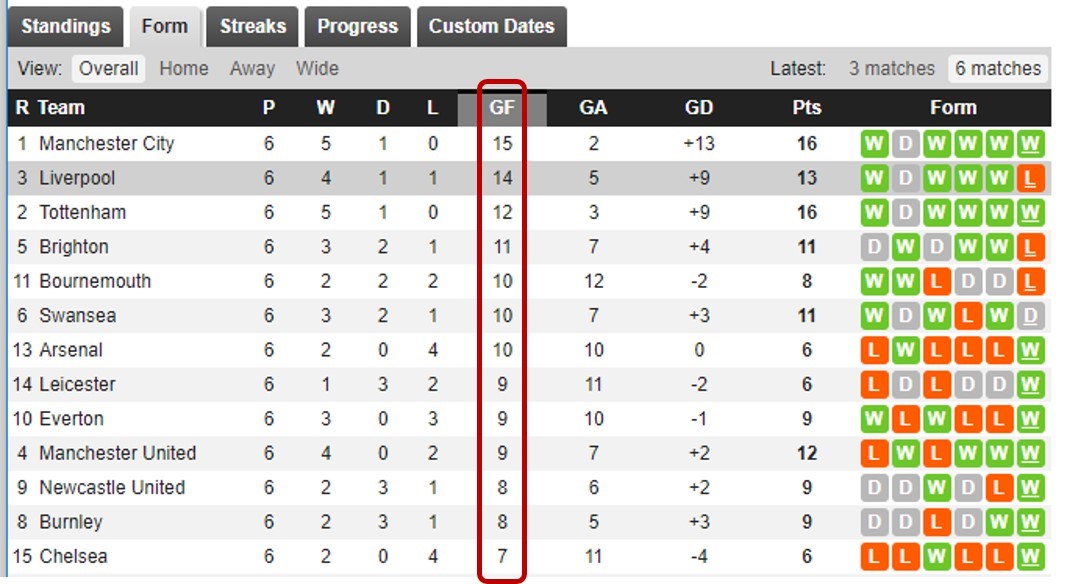
Figure 4: source – whoscored.com
| Overall Goals Scored per Game | Overall Total Goals per Game | Goals Scored in last 6 league games | Total Goals in last 6 league games | |
| Man City | 2.83 | 3.50 | 2.50 | 2.83 |
| Liverpool | 2.26 | 3.40 | 2.33 | 3.16 |
| Chelsea | 1.73 | 2.63 | 1.16 | 3.00 |
Arguably the most critical view of goals, however, is that of recent form. Clicking on the “Form” tab in this example shows that Man City are still winning, but their goalscoring (and defence) are both at reduced levels, so slightly lower scoring affairs are to be considered when betting on goals scored and total goals in their matches. Chelsea’s scoring rate has dropped considerably, even with a low overall goalscoring value. They’re currently a team far more likely to lose matches by a single goal margin, than a side winning by the same margin.
Read More: EPL Top Goal Scorer Predictions
Read More: Soccer Betting Prediction Websites
2 – How many goals, and when?
One of the most common and trickier bets to play are those relating to timing, be it goals in the first half vs the second half, goals in specific minutes.
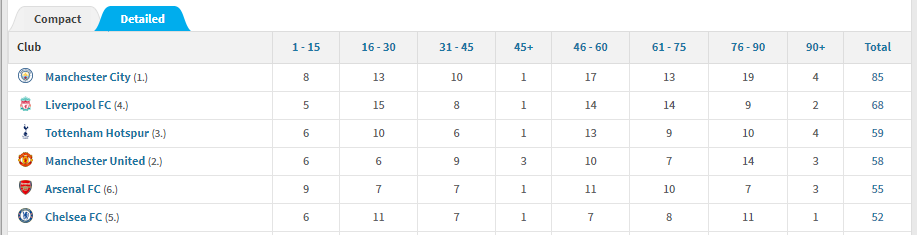
Figure 5: source – transfermarkt.com
| 1st Half Goals | 2nd Half Goals | |
| Man City | 38% | 62% |
| Liverpool | 43% | 57% |
| Chelsea | 48% | 52% |
| Top 6 Average | 42% | 58% |
Using the simple tables provided by www.transfermarkt.com (simply go the Premier League, and find the “Goals scored after minutes” tab, under “Clubs”), already a clear relationship emerges when looking at the English Premier League’s top 6; their propensity for 2nd half goals is high, especially at the top where both Manchester clubs enjoy a ratio 60/40 between 2nd half and first half goals. Both Guardiola and Mourinho’s sides also have a higher propensity for goals in the final 15 minutes compared to their peers. These numbers are useful to guide the potential of bets for scorelines and goals between the first and second halves of matches.
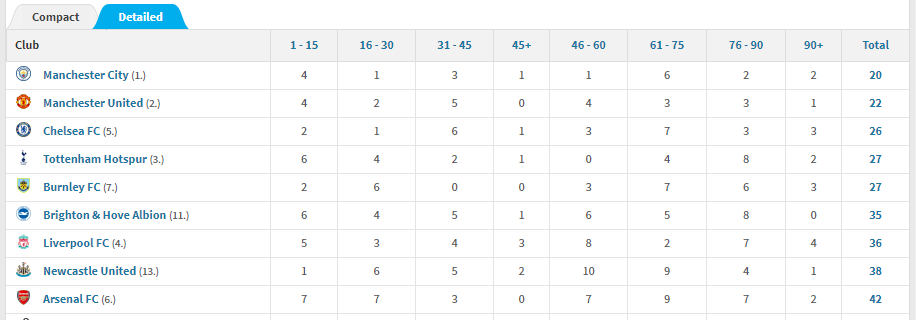
Figure 6: source – transfermarkt.com
A similar insight is revealed by looking at goals conceded by minute, and intriguingly, the top 3 sides in the league tend to conceding in the 1st half of matches, rather than away. When they concede, Man City (45%), Man United (50%) and Spurs (48%) all concede more the top 6 average of 43% in the 1st half of matches. Note Liverpool (11), Spurs (10) and Arsenal’s (9) tendency to concede in the last 15 minutes of matches as well.
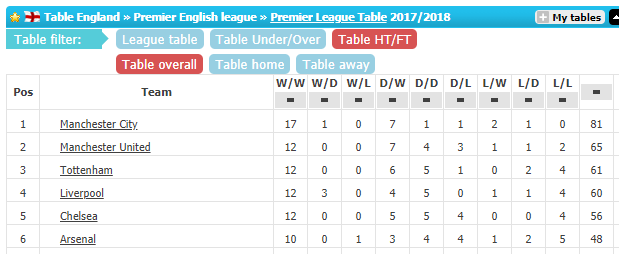
Figure 7: source – www.tablesleague.com
Another popular bet available to examine is that of the relationship between winning at halftime and and at fulltime. This table, available from www.tablesleague.com (make sure you click on Table HT/FT to see it) shows the record of the top 6 across the various game states between halves. Some revealing insights; of all the sides in the top 6, Liverpool have dropped the most winning positions (3) between halftime and fulltime. Man Utd, Spurs and Liverpool all hover around a 50% relationship of converting a draw at halftime to a win. Spurs and Chelsea have yet (this season) to convert a losing position at halftime to a winning one by the end of the match.
Read More: Soccer Betting Tips- Predicting the Goals Scored
The statistic for winning each half poses an interesting contrast to the extent where these sides score the first goal:
| Total Games | % where first goal was scored | Total Home Games | % where first goal was scored | Total Away Games | % where first goal was scored | |
| Man City | 30 | 80% | 15 | 87% | 15 | 73% |
| Man Utd | 30 | 57% | 15 | 67% | 15 | 47% |
| Spurs | 30 | 60% | 15 | 73% | 15 | 47% |
| Liverpool | 30 | 70% | 15 | 73% | 15 | 67% |
| Chelsea | 30 | 57% | 15 | 60% | 15 | 53% |
| Arsenal | 30 | 57% | 15 | 73% | 15 | 40% |
| Top 6 Average | 30 | 63% | 15 | 72% | 15 | 54% |
Betting enthusiasts could look at this view of the numbers to guide their choices on who will (or won’t) score first. The curious statistic in the example above is that of Liverpool, who are above the top 6 average in all respects, but remain a side that struggle to hold onto the strong advantage they typically start with.
Read More: Soccer Betting Guide
We hope you enjoyed this brief guide to some soccer betting tips on placing your bets! Keep a lookout for more features in the coming weeks.


